A route concept study on the Amsterdam - Frankfurt connection
This notion explores a study discussing the Amsterdam-Frankfurt hyperloop corridor, which is approximately 450 km long and connects two of the largest multimodal transportation hubs in Western-Europe. The study provides insights into the potential market for the hyperloop concept by analyzing existing travel options, projecting market growth scenarios, and applying assumptions on modal shift and induced demand to project hyperloop ridership in 2040. It also provides valuable insights into the design and cost considerations for the Amsterdam - Frankfurt hyperloop route. It evaluates three different route alignment scenarios for the Amsterdam - Venlo section of the route based on different criteria, such as trip time, transit speed, and infrastructure utilization. These scenarios include a high-speed scenario, a balance between transit speed and infrastructure utilization, and a low-cost scenario. The study also provides an overview of the impact of hyperloop on travel attributes compared to current modes.
Corridor context
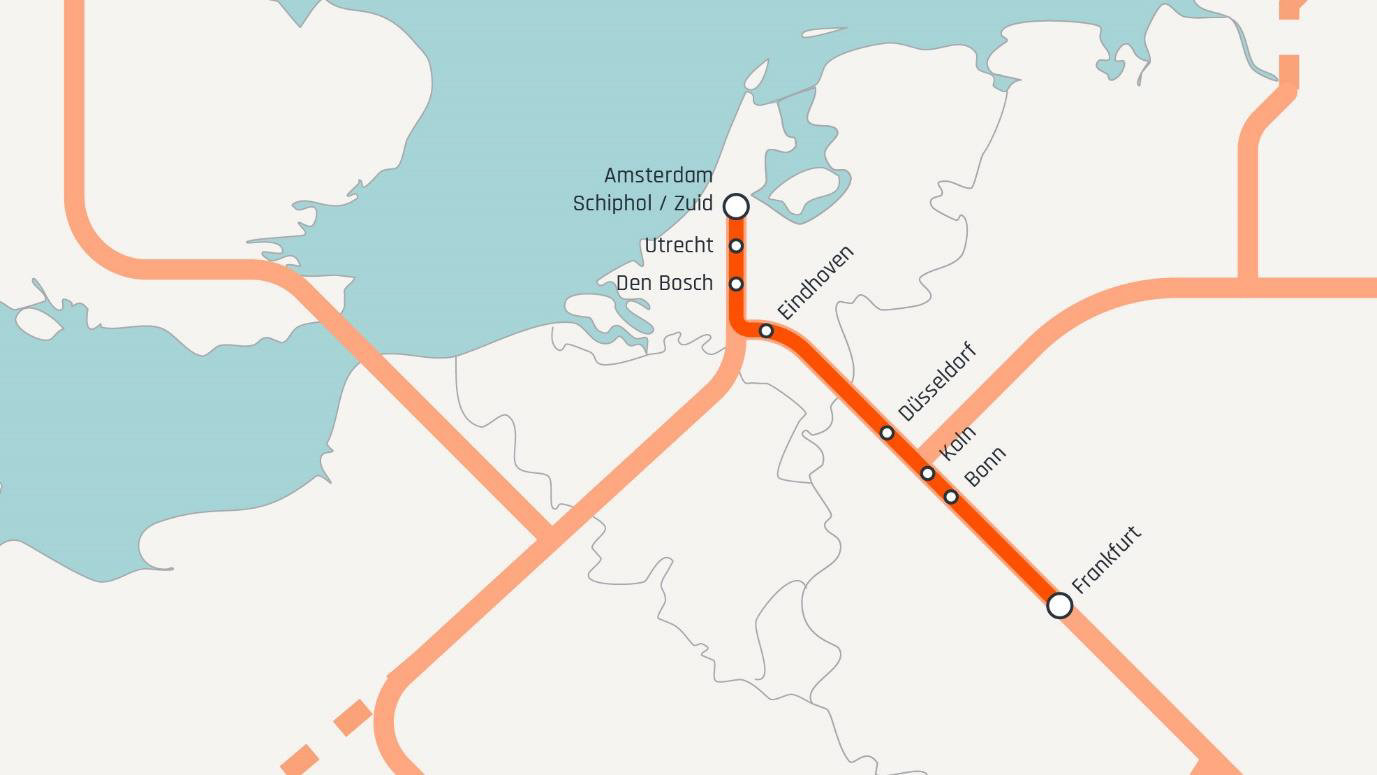
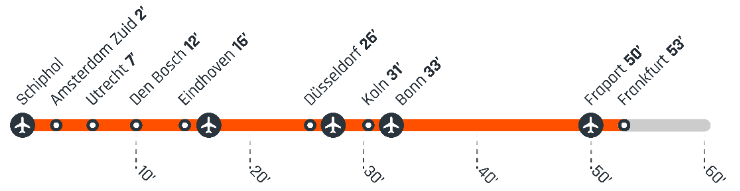
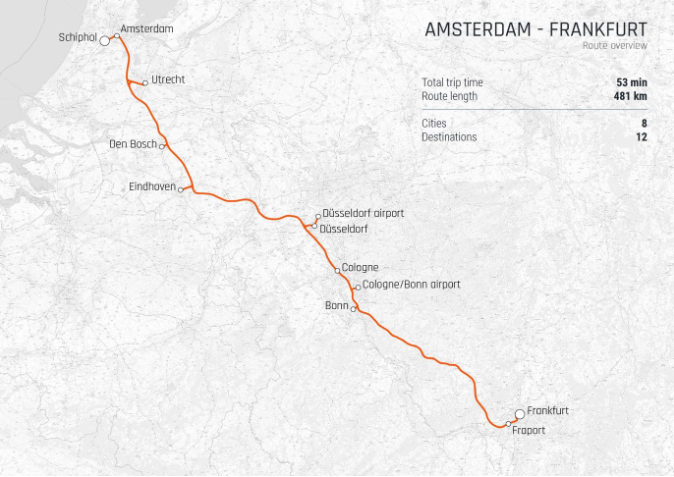
This section of the study discusses the Amsterdam-Frankfurt corridor, which is approximately 450 km long and connects two of the largest multimodal transportation hubs in Western-Europe. The route connects eight cities with a total of twelve stations, enabling direct connections between cities with a maximum in-vehicle time of 50 minutes from Amsterdam to Frankfurt (see figure below). The identified cities are based on population size, connection to major airports, and economic activity.
Demand and ridership forecast
The demand and ridership forecast for the Amsterdam-Frankfurt route provides insights into the potential market for the hyperloop concept. By analyzing passenger archetypes, existing travel options, projecting market growth scenarios, and applying assumptions on modal shift and induced demand, the study projects hyperloop ridership in 2040.
Passenger archetypes
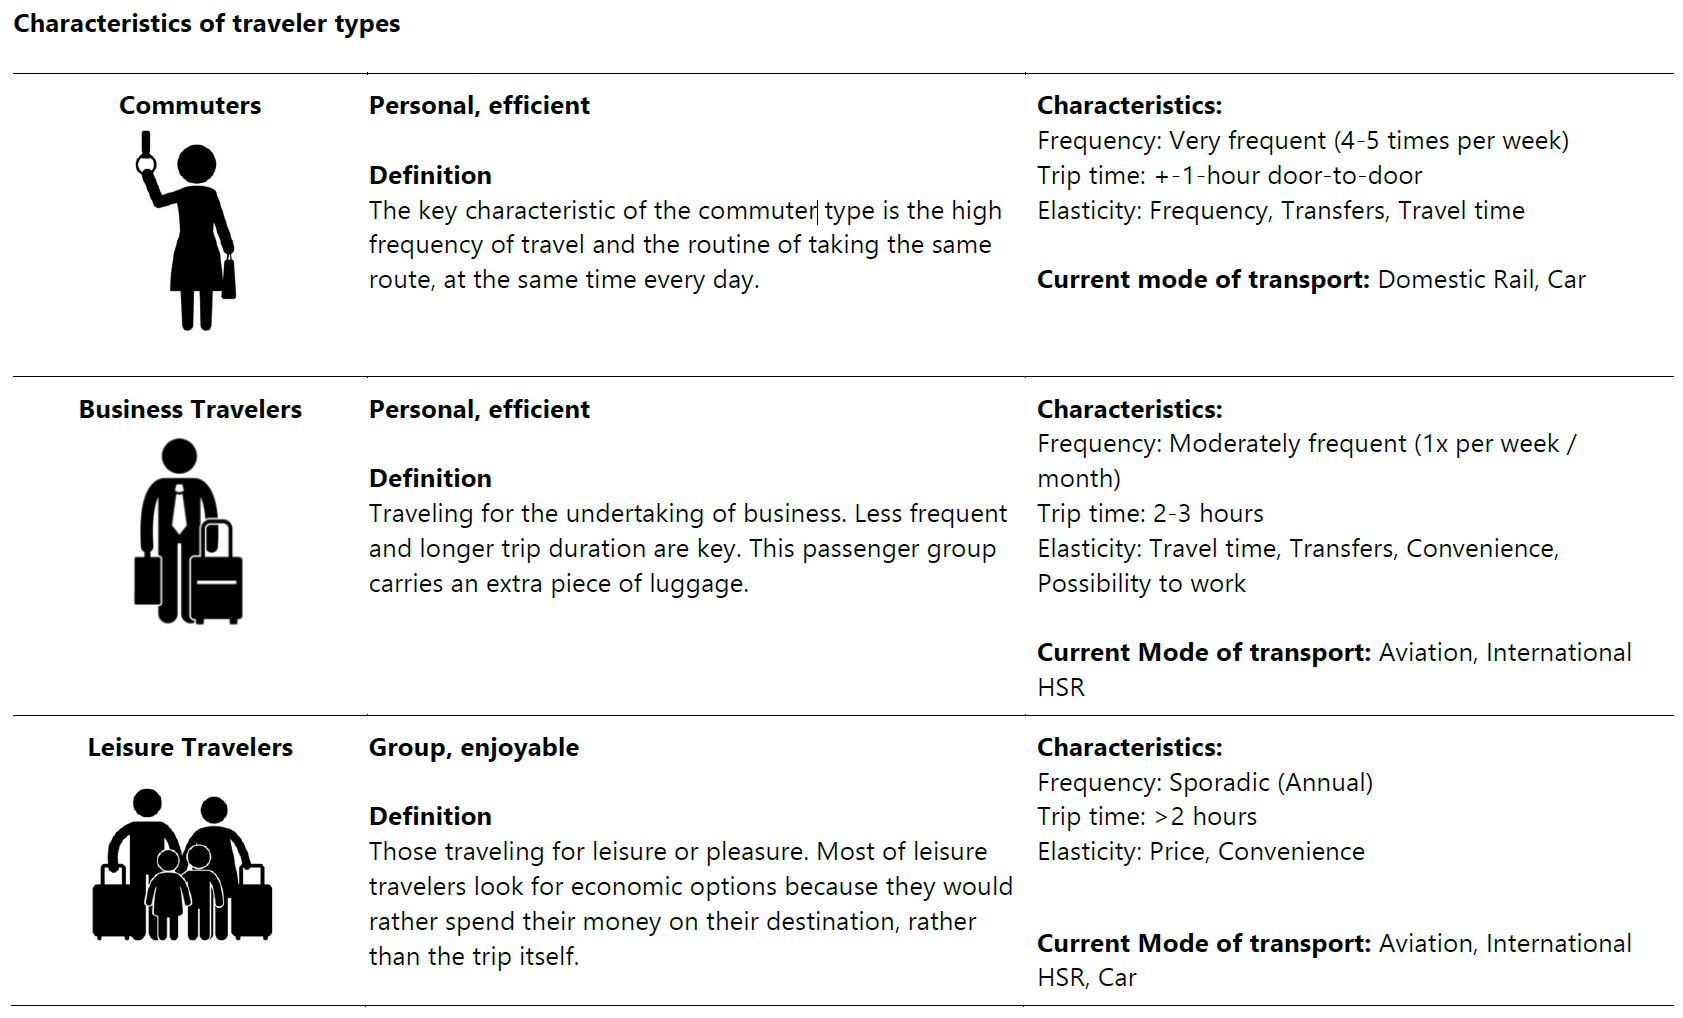
According to the study the hyperloop concept should focus on three main types of travelers: commuters, business travelers, and leisure travelers. Commuters, who travel frequently on high-frequency routes, are highly sensitive to trip time reduction if ticket prices remain comparable, which can lead to induced demand and modal shift. Business travelers, who travel less frequently but over longer distances, are also sensitive to trip time reduction and service improvements for modal shift but have limited induced demand. Leisure travelers, who travel sporadically, are more price-sensitive in their mode choice, and trip time reduction has a lesser impact on them.
Existing travel options
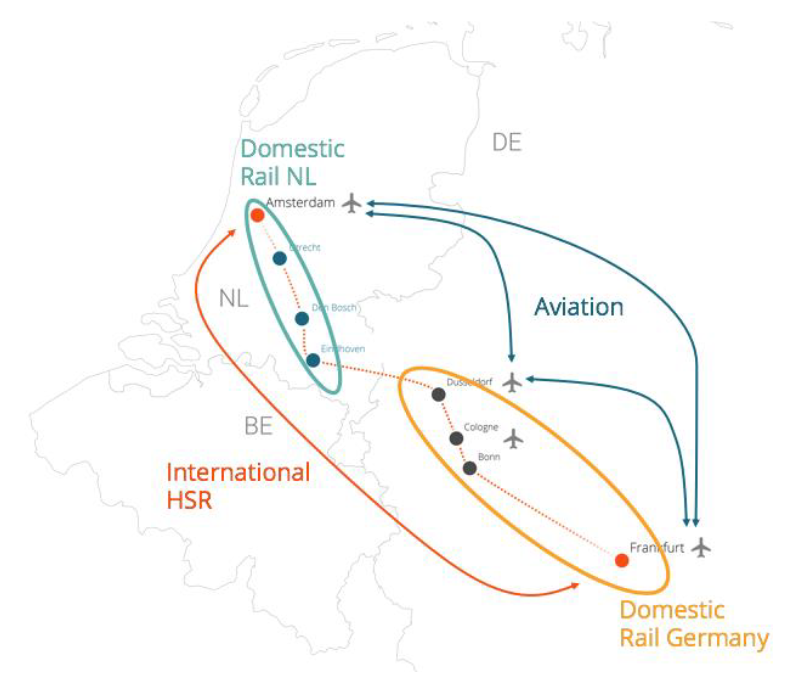
As visible in the figure below, existing travel options for the Amsterdam-Frankfurt corridor include domestic rail services in the Netherlands and Germany, international high-speed rail (HSR) services, and aviation. Modal shift from car and bus travel is not considered in the concept development study.
Growth scenarios
Growth scenarios are used to forecast future demand and ridership for transportation modes. The WLO scenarios refer to "WLO-high" and "WLO-Low" scenarios, which are economic growth scenarios used to forecast rail demand. The "WLO-high" scenario assumes an annual economic growth of 2% with strong population and economic expansion, while the "WLO-Low" scenario assumes an annual economic growth of less than 1% with limited population and economic growth.
For aviation demand forecasts, the study uses the "Global Growth" and "Most-Likely" scenarios from Eurocontrol. The "Global Growth" scenario projects strong global growth with technology addressing sustainability challenges in the aviation industry. On the other hand, the "Most-Likely" scenario forecasts moderate growth regulated to balance demand with sustainability concerns.
The projected growth percentages for each scenario by 2040 are as follows:
- Rail (WLO-high scenario): 42%
- Rail (WLO-Low scenario): 27%
- Aviation (Global Growth scenario): 84%
- Aviation (Most-Likely scenario): 53%
Market Analysis Total Transportation 2040
The transportation analysis of the Amsterdam-Frankfurt corridor is studied using publicly available data. The study breaks down the transportation modes into four categories: domestic rail in the Netherlands, domestic rail in Germany, International high-speed rail, and aviation.
- Domestic Rail Netherlands (2040 Predictions):
- Data sources used were from reports and were extrapolated using WLO-scenarios.
- The main route of interest is the Amsterdam-Eindhoven line, only counting passengers traveling between these cities.
- Expected annual trips in 2040 are predicted to range from 14,235,600 to 15,817,800.
- Domestic Rail Germany (2040 Predictions):
- Data was sourced from Eurostat and examined transport between Darmstadt, Dusseldorf, and Koln.
- The expected annual trips in 2040 range between 33,132,991 and 37,046,336.
- International High-Speed Rail (2040 Predictions):
- DB operates the Amsterdam-Düsseldorf-Cologne-Frankfurt route with daily services.
- Predicted trips between Amsterdam and Frankfurt in 2040 range between 3,175,000 and 3,550,000.
- Aviation (2040 Predictions):
- Data is based on Eurostat and DeStatis, focusing on airport pairs.
- Only Dusseldorf and Frankfurt have direct flight routes to Schiphol; Cologne-Bonn routes are indirect.
- The cumulative passenger demand in 2040 is predicted to be between 2,301,730 and 2,768,094.
In a comprehensive view of the Amsterdam to Frankfurt route, the total transportation numbers in 2040 could fluctuate between 52,845,321 and 59,182,230 passengers. Notably, domestic rail movements are forecasted to dominate, accounting for a vast 89% of all trips.
Induced Demand & Modal Shift
The unveiling of the hyperloop as a future transport contender promises to redefine mobility between major European cities. Several factors contribute to its appeal, most notably dramatic reductions in travel time, competitive ticket pricing, and integrated connectivity with current infrastructure.
When we delve into travel times, the hyperloop's advantages become clear. Consider the Amsterdam to Utrecht route: while the current journey stands at 60 minutes by conventional rail, the hyperloop promises to trim this down to a mere 36 minutes. This profound difference in speed isn't just confined to domestic routes either. Such substantial time savings have led experts to forecast a modal shift: they anticipate 70-90% of passengers from domestic rail, high-speed rail (HSR), and aviation potentially favoring the hyperloop.
On the financial side, hyperloop fares are set to rival those of existing transportation. For example, a journey from Amsterdam to Utrecht is projected to cost around €7.50 with the hyperloop, marginally more than the current €7.30 rail ticket. This competitive pricing strategy ensures travelers don't face steep premiums for the enhanced speed and comfort hyperloop offers.
Ease of transition between modes of transport is another strong selling point. Hyperloop stations are envisioned to be seamlessly integrated into the existing transportation landscape. This means that passengers can effortlessly transition from buses or traditional trains to the hyperloop, minimizing delays and maximizing convenience.
Overview Ridership
By 2040, using assumptions on modal shift and induced demand, annual ridership on the hyperloop route is projected between 49 to 71 million trips across different scenarios.
Scenario / Source | High (90% Modal Shift) | Low (90% Modal Shift) | High (70% Modal Shift) | Low (70% Modal Shift) |
Domestic Rail | 65,540,657 | 58,728,703 | 50,976,067 | 45,677,880 |
- Netherlands | 19,867,749 | 17,880,397 | 15,452,693 | 13,906,976 |
- Germany | 45,672,909 | 40,848,306 | 35,523,373 | 31,770,904 |
International HSR | 3,195,000 | 2,857,500 | 2,485,000 | 2,222,500 |
Aviation | 2,491,285 | 2,071,557 | 1,937,666 | 1,611,211 |
Total | 71,226,942 | 63,657,760 | 55,398,733 | 49,511,591 |
In the high scenario, passengers are mainly distributed across key city pairs. Notable connections include Amsterdam-Utrecht (5.87 million) and Dusseldorf-Koln (17.64 million).
Note: Some cities like Amsterdam and Frankfurt represent both airport and city center stations.
Route & Implementation
This section delves into the Amsterdam-Frankfurt hyperloop route, focusing on infrastructure costs, route scenarios, and design concepts. Three alignment scenarios for the Amsterdam - Venlo segment are evaluated based on factors like trip duration, speed, and infrastructure use. Infrastructure costs, encompassing aspects like the tube, foundation, and propulsion, are detailed. The section further explores the hyperloop's physical features, including curvature and access to stations, alongside design specifics like track layout and motor power.
Track Configuration & Topology
Infrastructure
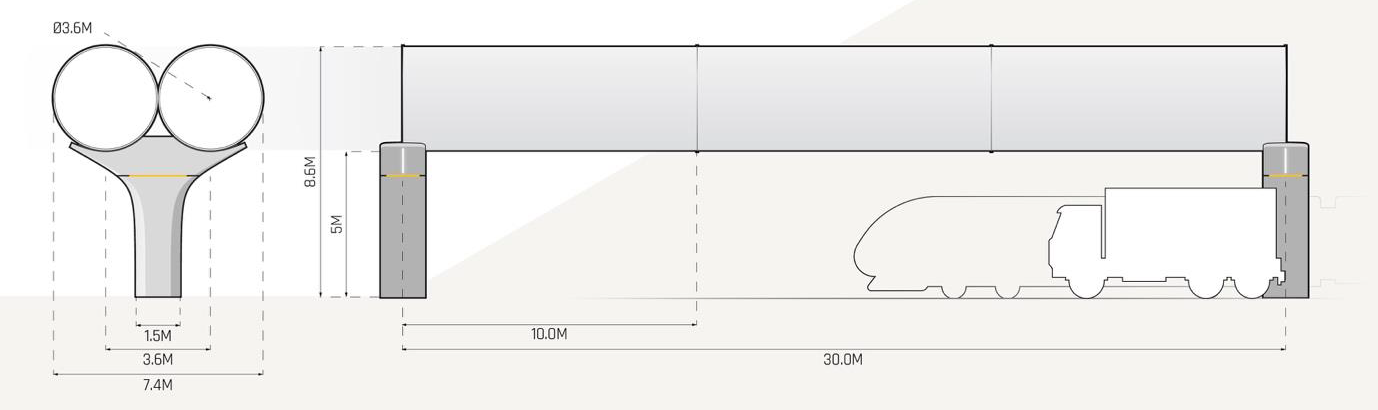
The hyperloop can be constructed above ground or underground. Above-ground structures stand on pillars, enhancing safety by reducing conflicts with other infrastructures. For context, 84% of European rail accidents arise from track-level crossings. The hyperloop tube will be elevated 5 meters above ground to prevent collisions with ground vehicles.
Curvature
- Factors such as curvature and available space play a role in hyperloop operations.
- The track's curvature impacts hyperloop speeds, and the current design considers spatial constraints and the power of its linear electric motor. This design accommodates a 30-degree incline.
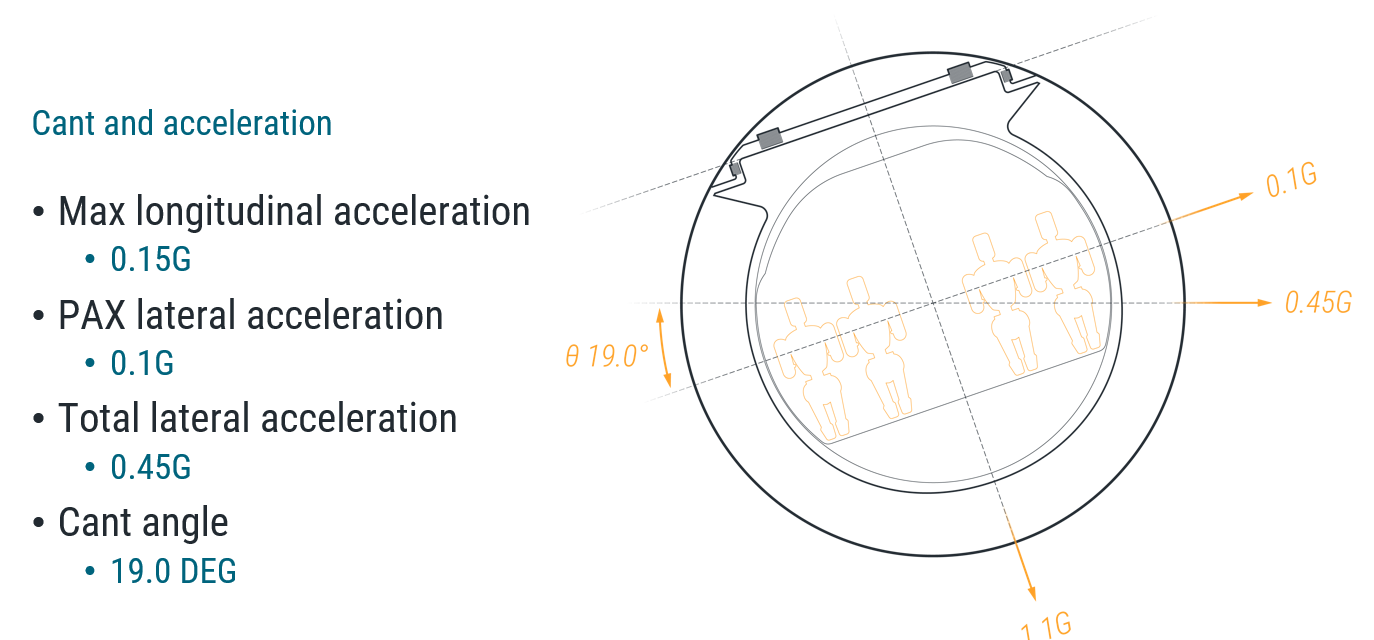
- Human comfort limits horizontal and vertical radii during movement. To combat the effects of centrifugal force, the hyperloop vehicle can tilt up to 19 degrees (as shown in the picture below).
- The vehicle's design takes into account track inconsistencies and elevation changes, aiming to ensure passenger comfort. High tilt angles are being explored to retain speed during turns. The tilt angle significantly influences the length of cornering radii, especially as it relates to transit speed.
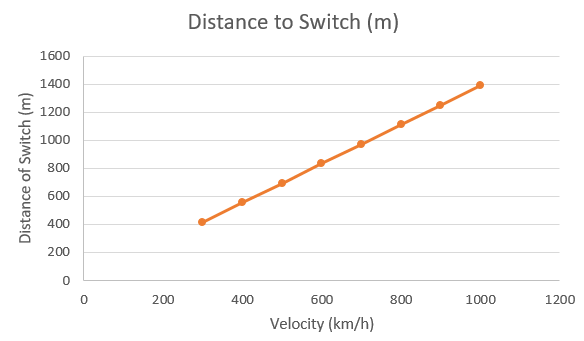
Turnouts to Stations
In the hyperloop's design for turnouts to stations, there's a departure from the conventions seen in high-speed rail. Instead of using movable tracks, the hyperloop track remains static (see picture below). It's the vehicle itself that determines its direction during a switch, allowing it to shift routes even at high speeds just before station entries.
This unique switch system offers two major advantages. Firstly, stations en route do not act as a bottleneck, ensuring smooth operations across the hyperloop network. Secondly, it allows multiple pods, even those headed to different destinations, to utilize the same tube infrastructure. This design approach not only maximizes efficiency but also facilitates direct connections, eliminating the need for transfers or intermediate stops.
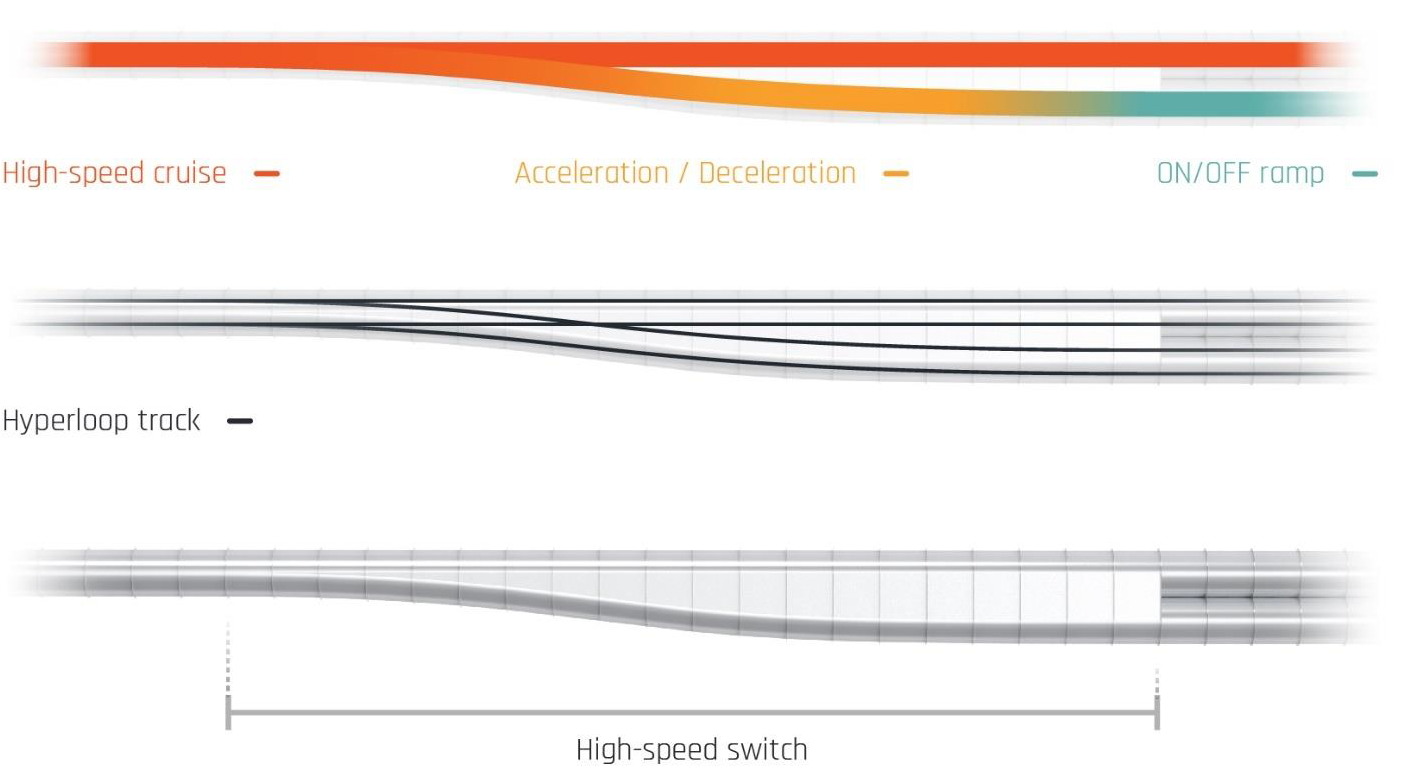
The distance required for these switches depends on the pod's velocity (as shown in the figure below). For a pod traveling at 1000 km/h, the switch stretches for about 1.5 km, while at 600 km/h, the switch measures around 900 meters.
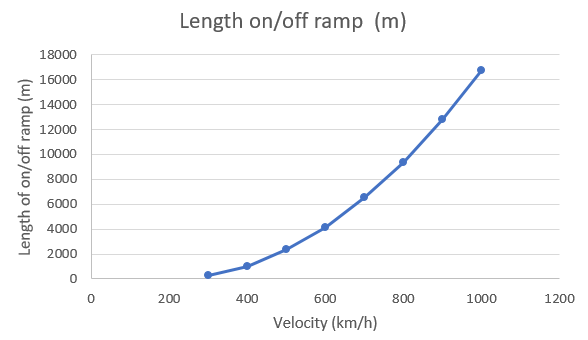
Furthermore, the design also incorporates on/off ramps, separate tubes branching off the main one. Their length is determined by the required deceleration from the cruise speed down to 200 km/h. To illustrate, slowing down from 1000 km/h to 200 km/h demands a ramp length of approximately 16.5 km, whereas a deceleration from 600 km/h to 200 km/h requires a ramp of about 4 km.
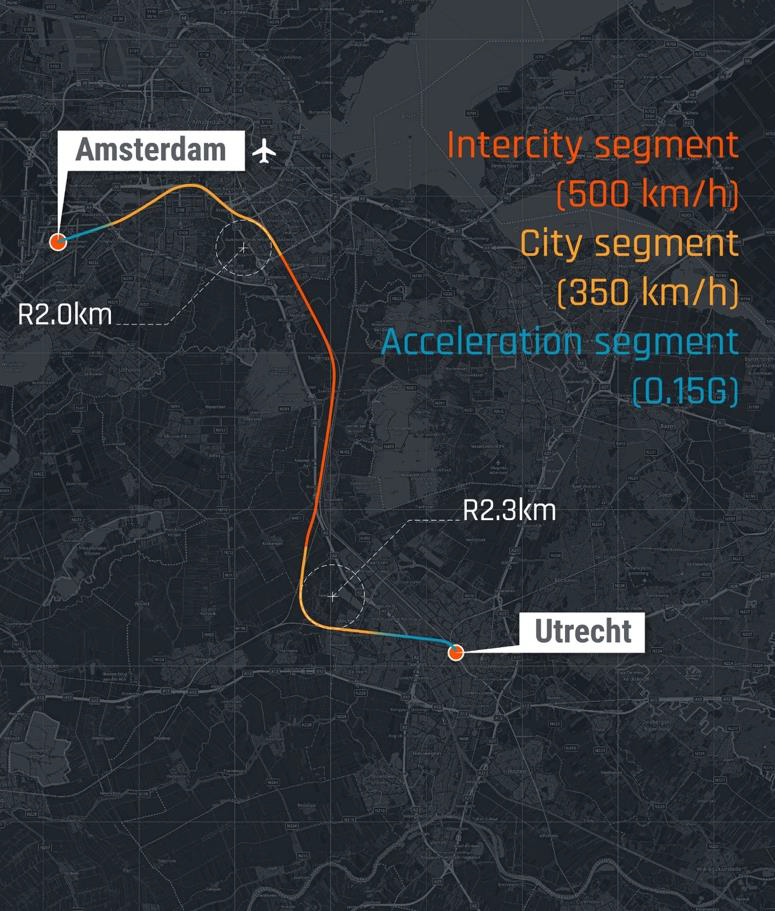
Corridor Segments
Hardt has classified the infrastructure track into distinct segments, each tailored to unique characteristics and functionalities. The "Intercity" segments allow pods to travel at cruise speeds with control systems focusing on consistent velocity, necessitating low power linear motors and large corner radii. The "City" segments traverse heavily urbanized areas, with track geometry harmonizing with the urban environment, requiring low power linear motors and accommodating smaller to medium corner radii. The "Acceleration/Deceleration" segments serve as transitional zones between urban and cruise sections, demanding high power linear motors for speed modulation and medium to large track corner radii for optimal acceleration. The figure to the right illustrates the corridor divisions, highlighting the segments between Amsterdam and Utrecht as an example.
These are the three different proposed scenarios:
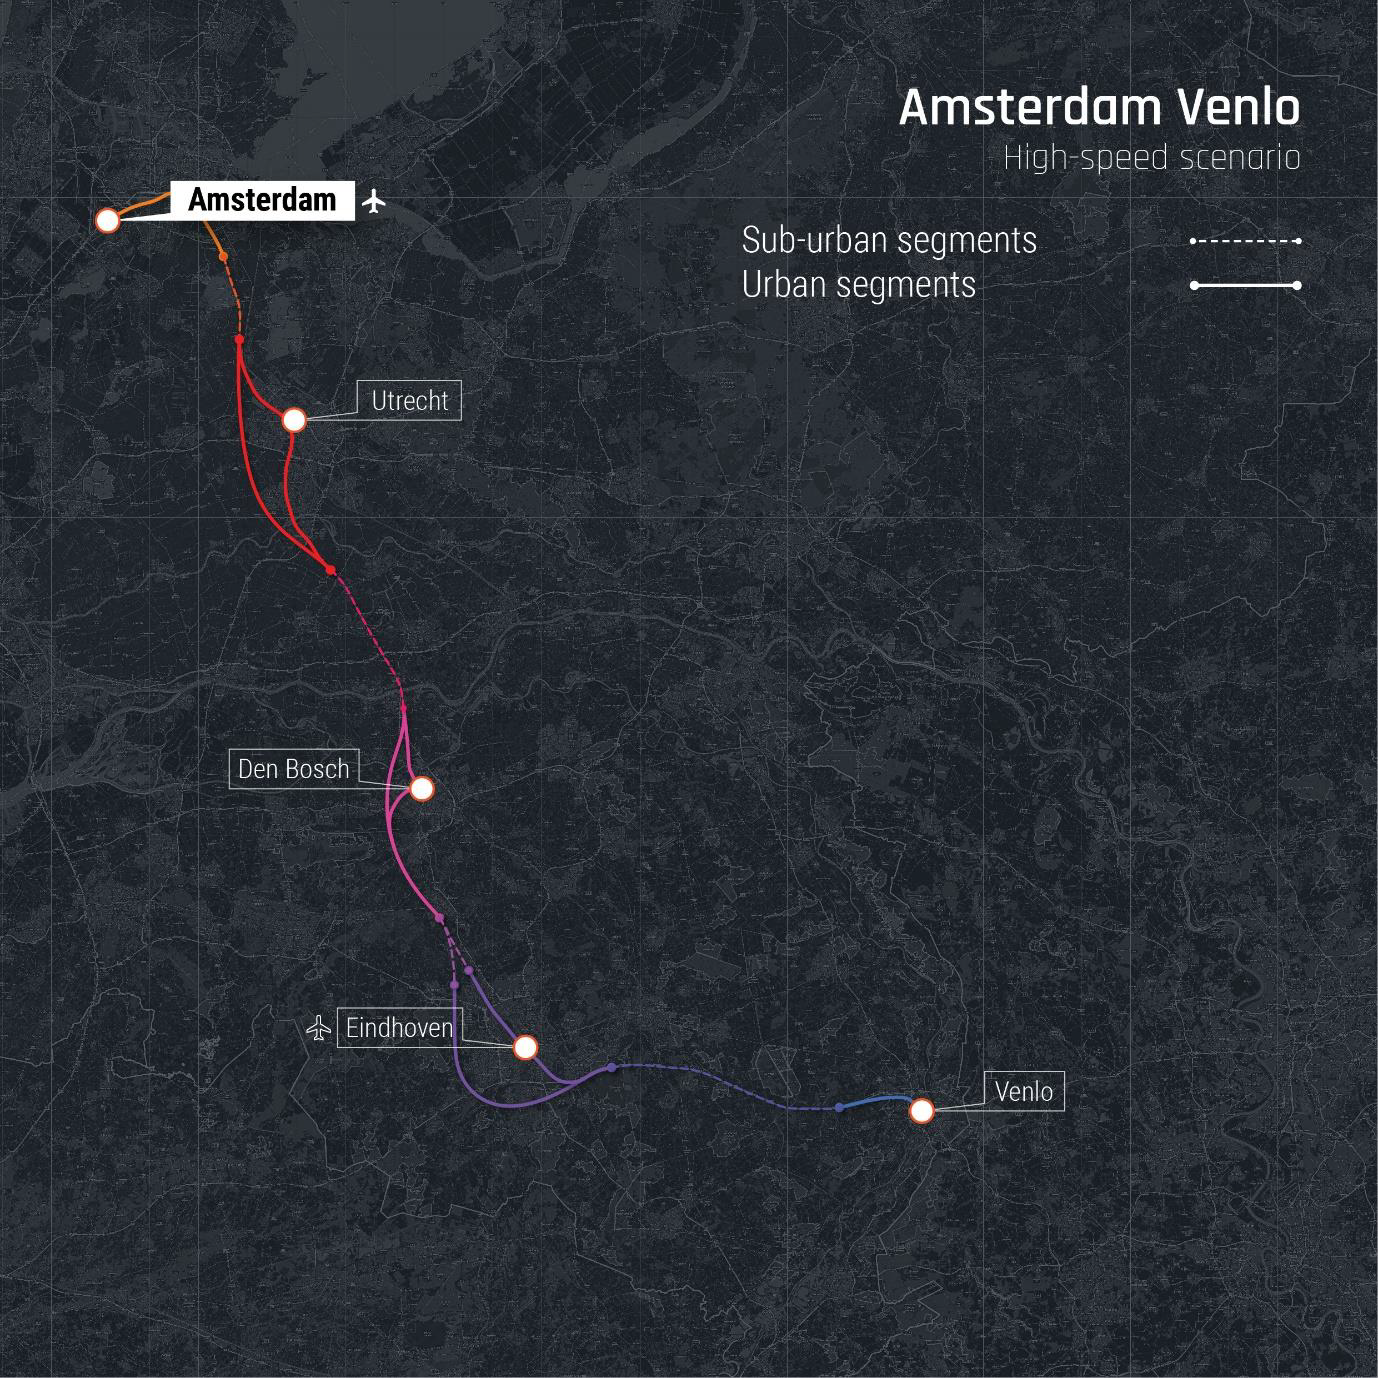
Scenario A - High-speed Scenario
This scenario prioritizes high-speed transit and the shortest possible travel time between Amsterdam and Frankfurt. As a result, the route alignment has a higher number of curves, requiring more energy to maintain high speeds.
This scenario has a trip time of 21 minutes, an average velocity of 539 km/h, a total route length of 261 km, and an estimated total infrastructure cost of €9.6B.
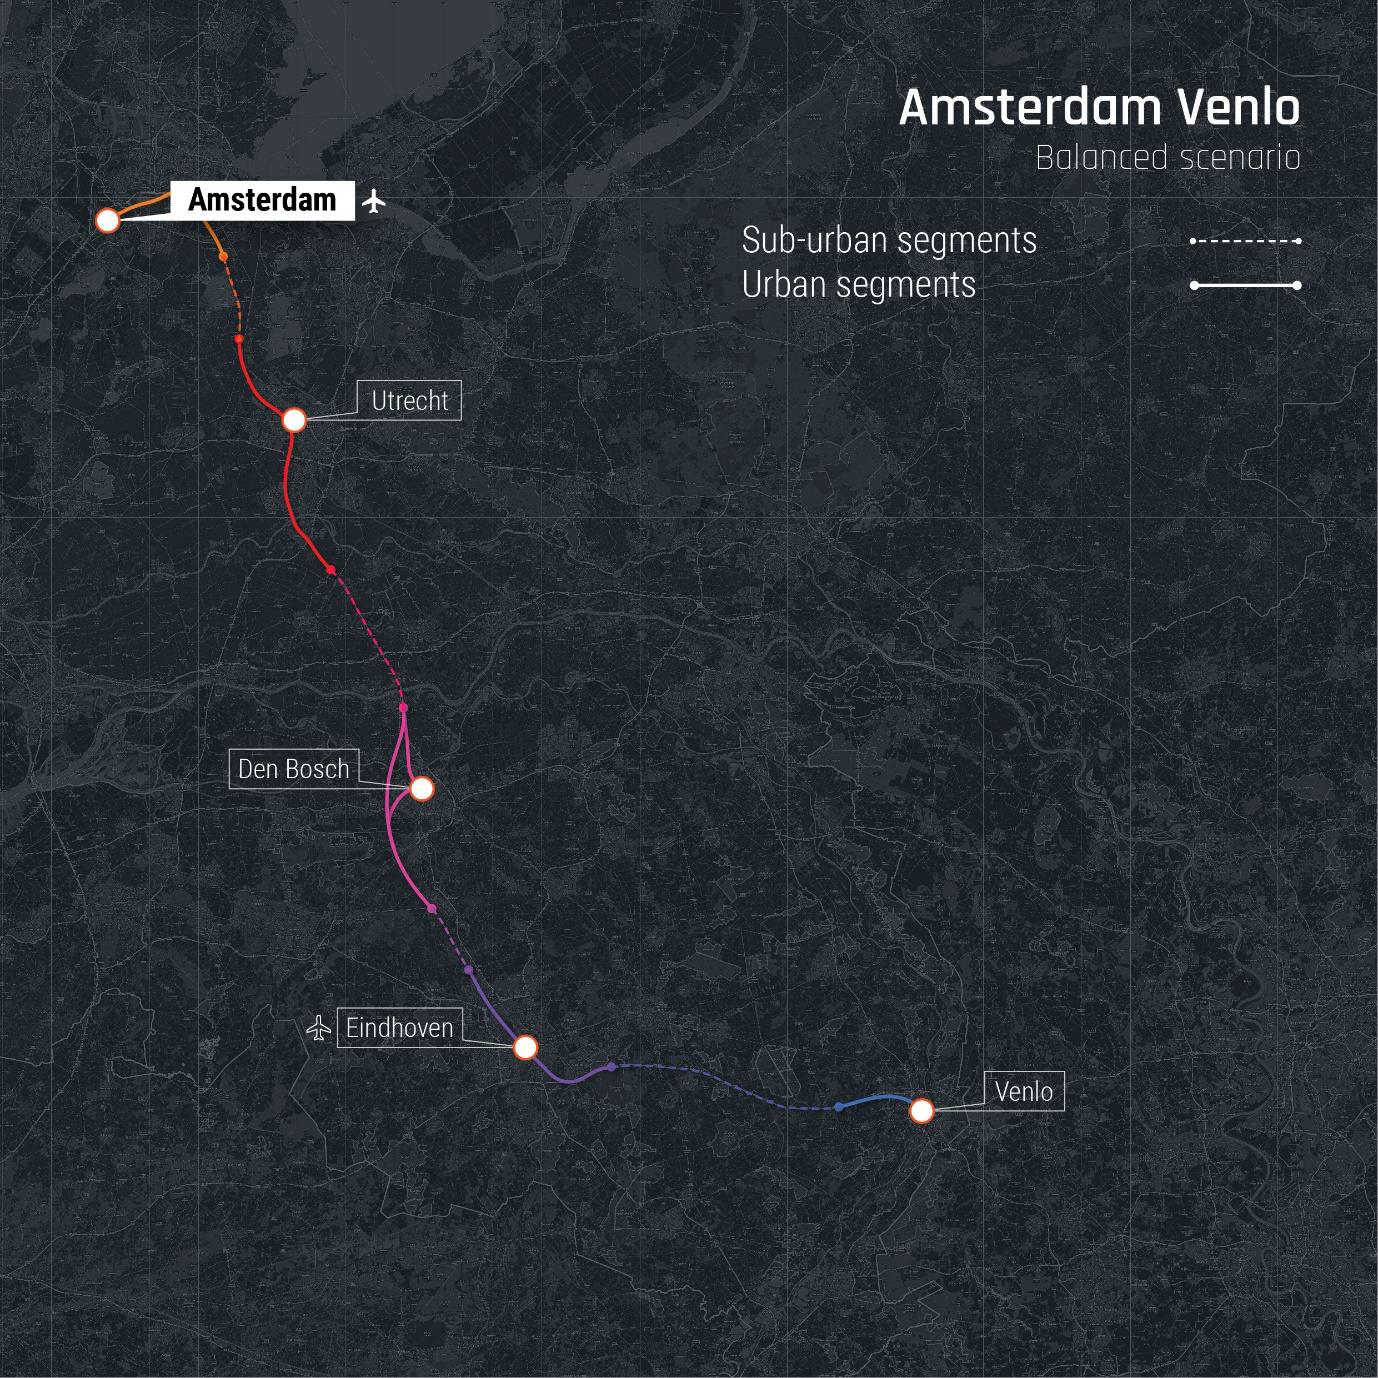
Scenario B - Balance between transit speed and infrastructure utilization
This scenario balances high-speed transit with the utilization of existing infrastructure, which reduces costs and construction time while increasing accessibility and connectivity. The route alignment follows existing right-of-way as much as possible, with a reduced number of curves and a lower average velocity.
This scenario has a trip time of 26 minutes, an average velocity of 473 km/h, a total route length of 220 km, and an estimated total infrastructure cost of €5.7B.
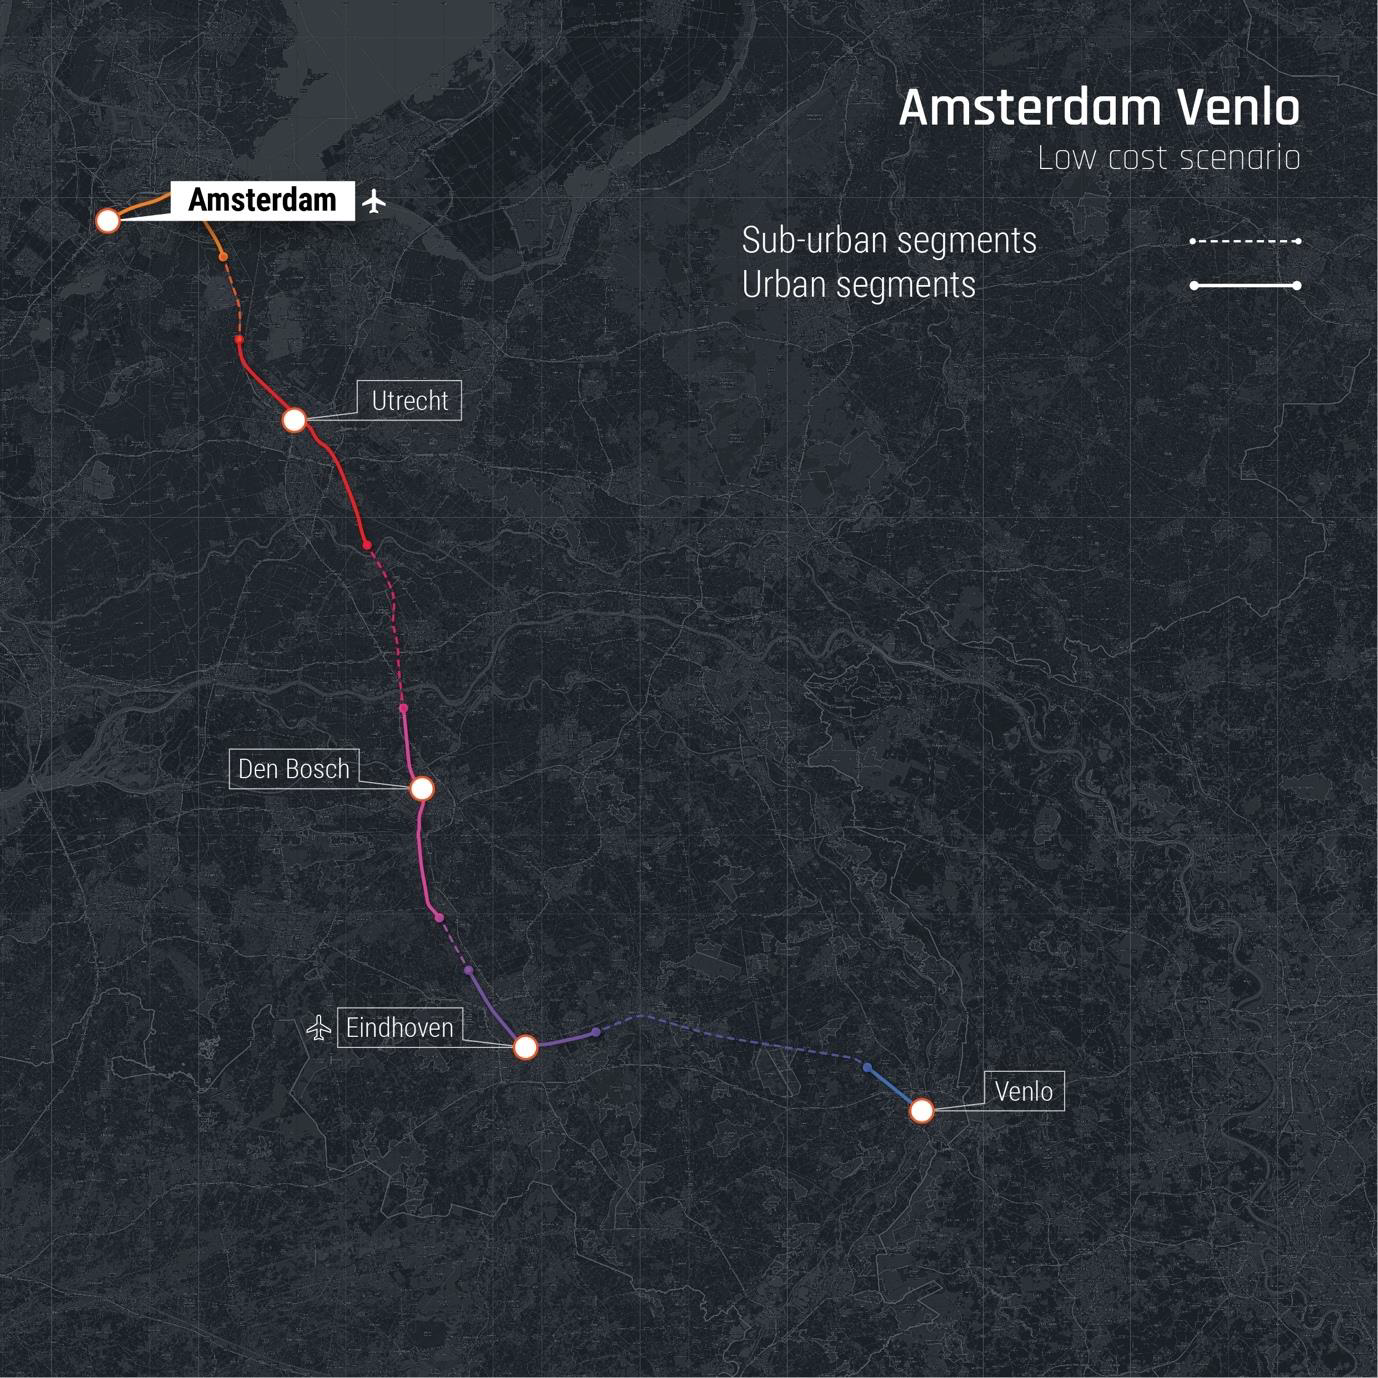
Scenario C - Low-Cost Scenario
This scenario prioritizes low costs and construction time, with a route alignment that follows existing right-of-way as much as possible and a high number of curves. The average velocity is lower than in Scenario A and B, and the trip time is longer.
This scenario has a trip time of 32 minutes, an average velocity of 350 km/h, a total route length of 185 km, and an estimated total infrastructure cost of €4.7B euros.

Optimized Scenario B - Zen Scenario
This scenario is an optimized version of Scenario B that balances the utilization of existing infrastructure with minimal transit time sacrifice. The route alignment has fewer curves and follows existing right-of-way, with a slightly longer route length and a higher average velocity.
This scenario has a trip time of 21 minutes, an average velocity of 493 km/h, a total route length including on/off-ramps of 223 km, and an estimated total infrastructure cost of €6.1B euros. It covers a distance of 425 km and passes through eight cities and twelve stations. The total length of the route, including on and off ramps, is 481 km.
Quick Scan of Scenarios
Criteria | Scenario A | Scenario B | Scenario C | Optimized Scenario B |
Trip time (min) | 22 min | 27 min | 32 min | 21 min |
Average velocity (km/h) | 540 km/h | 473 km/h | 350 km/h | 492 km/h |
Total route length (km) | 281 km | 220 km | 185 km | 223 km |
Est. Total infra costs (€#B) | €8.2B | €5.7B | €4.7B | €6.1B |
Existing infrastructure followed (%) | 39% | 70% | 84% | 70% |
Conceptual Design Route Alignment Amsterdam - Frankfurt
Taking the findings form the table above into consideration, Hardt extrapolated the optimized scenario B results (Zen Scenario) of the quick-scan from the Dutch section of the route towards the whole Amsterdam-Frankfurt route.
The total distance to cover from Schiphol to Frankfurt is 425 km. Hyperloop provides direct
connections between 8 cities through 12 stations. Including on/off ramps the total length of
the route is 481 km (as shown in the figure below).
Business case
This comprehensive analysis delves into the economic feasibility of the Amsterdam-Frankfurt hyperloop route. Specifically, it examines demand projections, projected ridership, financial viability, wider economic benefits, and key sensitivities including CO2 reductions, noise impacts, value of time, and capital and pricing considerations.
Key findings of the business case analysis are the following:
- Demand & Ridership: Based on the 'Demand and ridership forecast', demand numbers projected to 2040 reveal an estimated annual ridership ranging between 49 million (low scenario) to 71 million (high scenario) passenger trips for the entire route.
- Economic Return: Including wider economic benefits, the full Amsterdam-Frankfurt route produces a 6.3% Economic Rate of Return. However, when looking solely at the Dutch segment (Schiphol to Venlo), the ridership does not justify the infrastructure investments.
- CO2 Reduction: Hyperloop's low-emissions technology showcases significant CO2 reduction potential:
- Reduction of 28-grams of CO2 per passenger kilometer against rail.
- An impressive reduction of 119-grams of CO2 per passenger kilometer when juxtaposed with aviation.
- Total projected CO2 reductions amount to 31,261 tonnes annually for the Dutch route and 285,288 tonnes annually for the full route.
- Noise Impact: A decrease in noise from a reduction in plane landings and takeoffs could translate to estimated economic benefits of approximately €7M annually.
- Value of Time: Hyperloop's quicker transport times could lead to sizable value of time savings:
- €9.25 per hour for rail passengers.
- €51.00 per hour for aviation passengers.
- Financial Feasibility: With the inclusion of wider economic benefits, the full hyperloop route could operate at a robust 43% profit margin.
- Sensitivity Analysis:
- For the low-demand and 70% modal shift scenarios, the full Amsterdam-Frankfurt route remains economically feasible.
- A 50% increase in capital expenditure (CAPEX) estimates still maintains a positive Economic NPV.
- A 50% ticket price reduction would render the route economically unviable. However, it remains feasible until a 40% reduction in ticket prices.
To conclude, the broader Amsterdam-Frankfurt route exhibits strong potential, both economically and financially, especially when incorporating broader economic benefits. However, meticulous validation of ticket price estimations is crucial in subsequent studies to ascertain the sustained economic viability of this venture. On the other hand, the standalone Dutch segment requires further investigation regarding its feasibility.
Conclusion
The Concept Development Study meticulously examined the feasibility of a hyperloop system between Amsterdam and Frankfurt. This corridor, spanning 450 km and connecting eight cities with twelve strategically placed stations, has the potential to dramatically alter the commute for over 4.3 million residents. Current journeys taking about four hours by ground transport or just over an hour by plane could be condensed to 53 minutes.
By 2040, the report projects an annual ridership of 49 to 71 million passenger trips, driven by an expected shift of 70%-90% of travelers from existing rail, HSR, and aviation to the hyperloop. Financially, the route promises a return that exceeds the cost of capital and offers positive economic returns, even before factoring in broader economic benefits.
However, it's essential to highlight that while the entire Amsterdam-Frankfurt route is technically and financially viable, the standalone Dutch segment doesn't align with feasibility based on current projections.
Looking forward, the study indicates areas for further exploration: wider economic benefits, operational planning nuances, comprehensive financial assessments, and the complex world of permits and policy regulations. Additionally, a 2019 collaboration with the Royal Schiphol Group will investigate the hyperloop's potential impact on airport accessibility.
Acknowledgements